Time selection & results#
Selecting a time region#
First, navigate to a region of the Time-trace Plot that you would like to study in more detail.
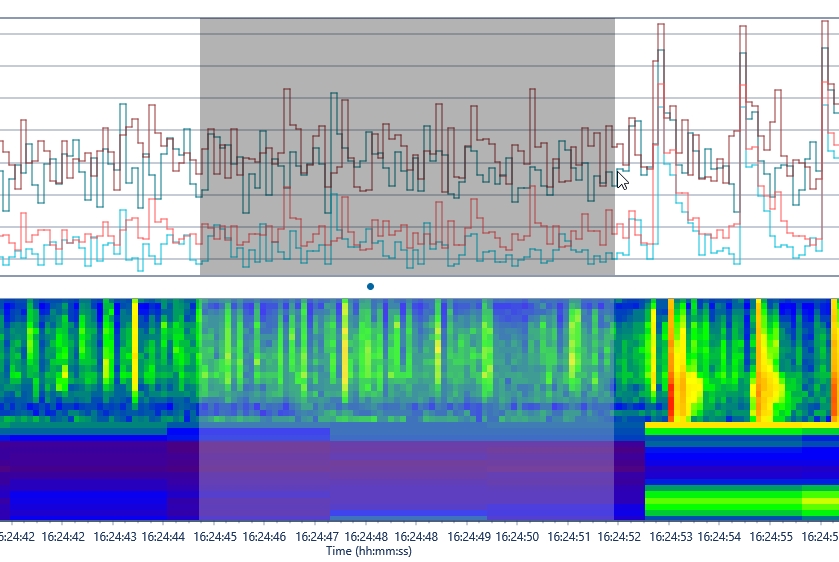
To make a time selection, left-click and drag from left to right over the region. The region will be highlighted in grey.
Hint
You can select the whole visible signal by using CTRL-A.
Overview#
In the Overview tab that new information is displayed for each source for the selected time period. This includes:
- the start and end times
- the duration
- the RMS level
- various statistical parameters
- the maximum and minimum RMS values
- the peak level and SEL values

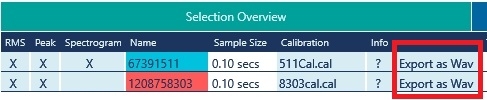
There is also the ability to export the time selection as a Wav file for each of the sources. To do this:
- select the Export as Wav button (this will open a save window)
- Enter in a file name and select Save.
Charts#
Select the Chart tab to see one-third octave band spectral levels for each source.
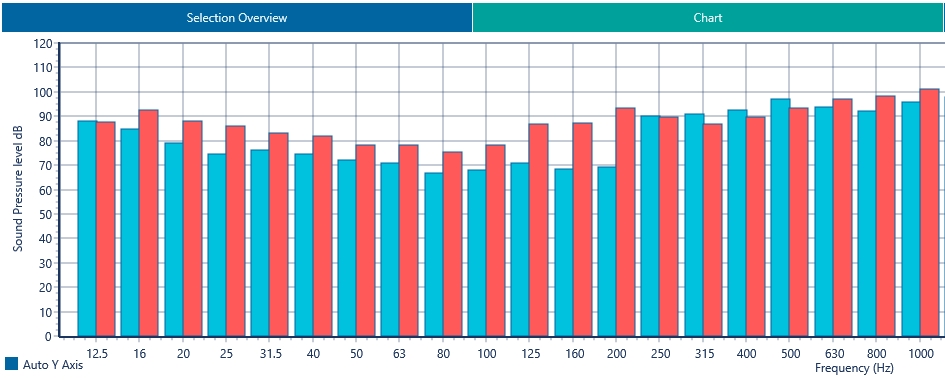
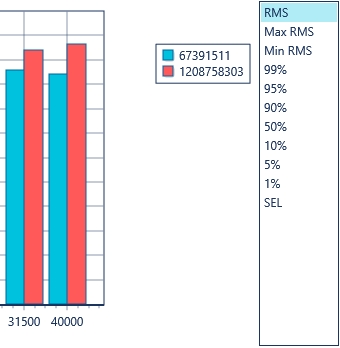 You can view the spectral levels as a statistical parameter or as an SEL by clicking the option buttons to the right.
Tables#
The Table tab displays the one-third octave band spectral levels for each of the key metrics, including the RMS statistical and SEL for each of the sources.
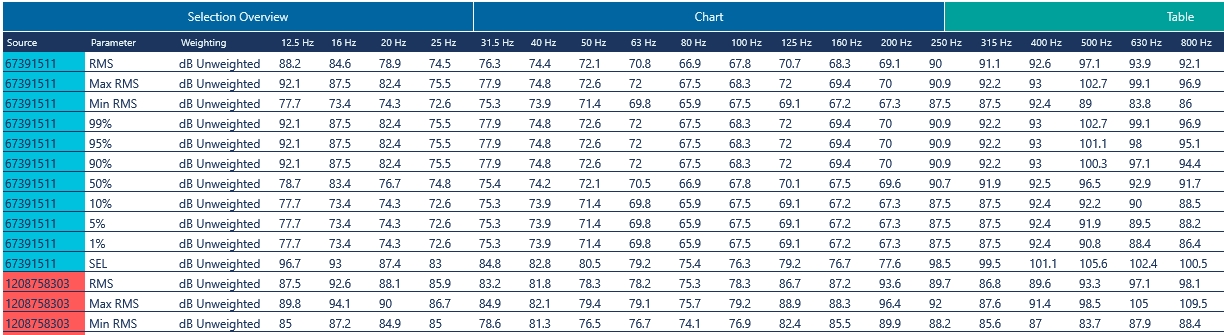
You can copy this table to Clipboard by selecting this button for pasting into other applications such as Excel. You can also copy all sample levels to clipboard which copies the raw data from the LVX files for the selected time period, or copy all sample levels to file which will copy the raw data to a file.
Time Periods#
Time periods allows the user to calculate the statistics of selected sound level results in defined periods of time.
The results of this calculation are found under the ‘Time Periods’ tab in the bottom half of the dBWav front screen.
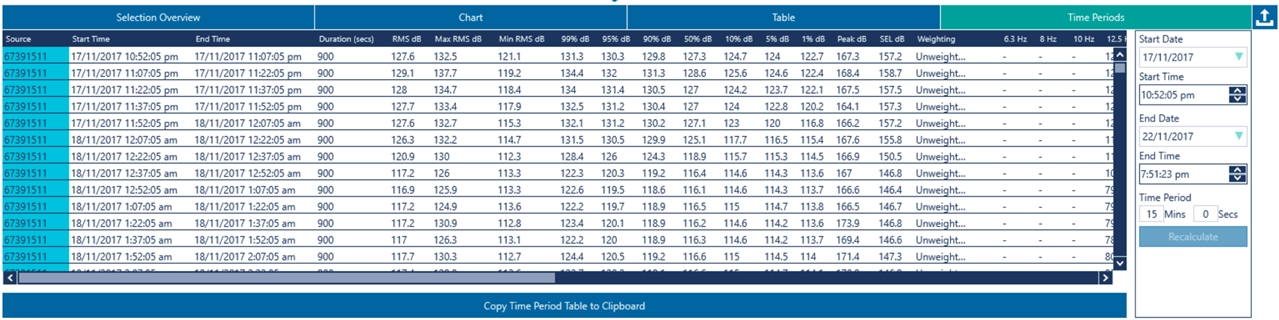
The time period defaults to 15 minutes, but this can be changed in the entry field to the right of the time periods table. The time periods are initially calculated over all the loaded level information. The start and end dates and times can also be altered in the entry fields to the right of the time periods table. After entering new times or periods, the ‘Recalculate’ button will be highlighted and needs to be clicked to recalculate the new time period results.
The Time Period Table can be copied to the clipboard by clicking the button at the bottom.
Applying weightings#
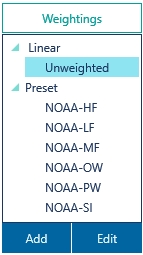
You can also weight the spectrum by clicking the ‘Weightings’ button  to reveal the weightings pop-up menu.
The default has been set to Linear or unweighted. The other options are A weighting, phocid pinnipeds, otariid pinnipeds, high frequency cetaceans, mid frequency cetaceans and low frequency cetaceans.
On the Overview tab, you will see that the weighting is also applied to the levels shown here, and similarly in the Chart tab.
Exporting#
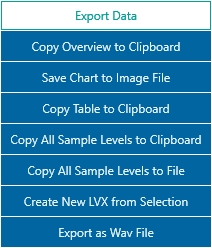
Clicking the export button  will show a range of options for exporting the data to other applications, e.g.
- Tables can be copied to Excel
- Charts can be saved as an image file
You can also copy all sample levels to clipboard which copies the raw data from the LVX files for the selected time period, or copy all sample levels to file which will copy the raw data to a file.