Tags#
Adding a new tag#
Navigate to an event where you would like to add a tag. Left click and drag over the region of interest.
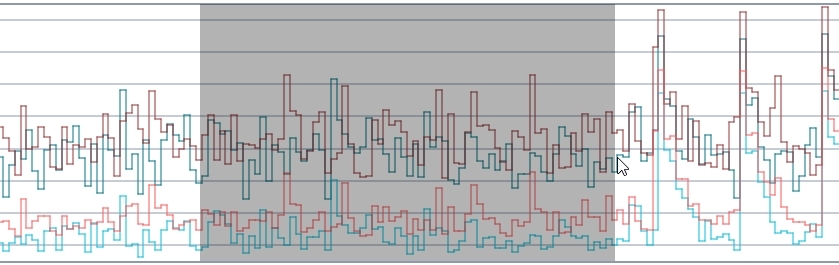
Click the Tags button  .
Select Add Tag on the right side of the main window.
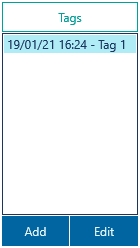
In the Tag Data window, enter a name for the tag, any comments, and select OK.
The user can also check 'Exclude tag from calculations' to ensure that the region of interest is not included in statistical calculations.
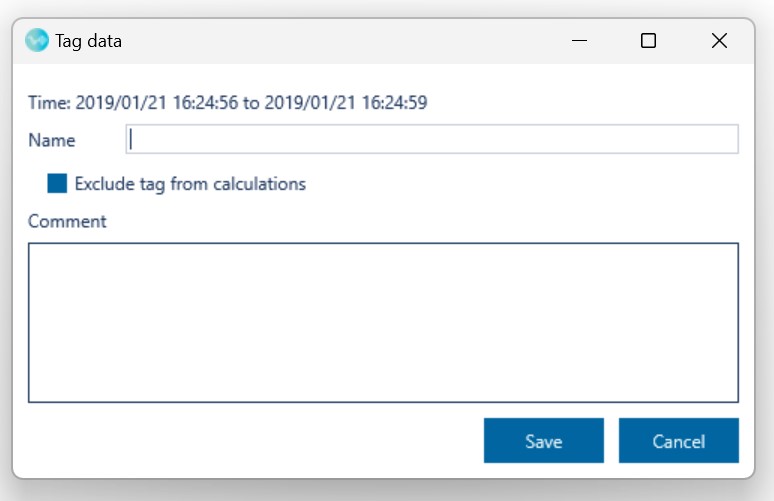
The new tag is now shown in the Tags list.
A blue bar is also shown across the top of the Time-trace Plot to visually identify the newly tagged region of the time-trace.
If 'Exclude tag from calculations' is selected then a yellow bar is displayed.
Editing tags#
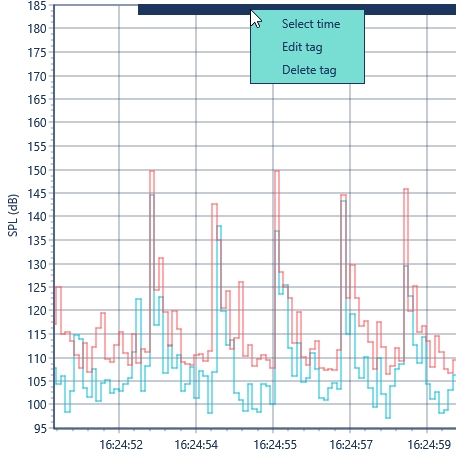
To reselect the tag, chose the tag from the Tags list or right-click the blue bar at the top of the Time-trace Plot and chose ‘Select time’ .
When a tag is selected, the sound levels presented in the Overview, Chart and Table tabs at the bottom of the main window all relate to the time interval of the tag.
To edit a tag, right click the blue bar at the top of the Time-trace Plot and chose Edit. The Tag Data window will appear, allowing you to edit the tag details.
To delete a tag, right click the blue bar at the top of the Time-trace Plot and chose Delete tag.
Saving tags#
Tags are automatically saved to the LVX files. When the LVX files are opened again, all the saved tags will be shown.