Advanced analysis#
Advanced analysis options#
You can view the spectral/energy content for the selected period by clicking on FFT/Bands/Exposure buttons to the top right of the time trace plot.

FFT#
FFT will calculate a Fast Fourier Transform. The time to calculate the FFT increases significantly with longer selection periods. This is because the FFT is calculated from the full-resolution measurement files. The FFT function should generally be used for selections of less than 1 minute. A warning will display for selections longer than 1 minute.
Increasing the overlap and window length increases resolution, but also the processing time required.
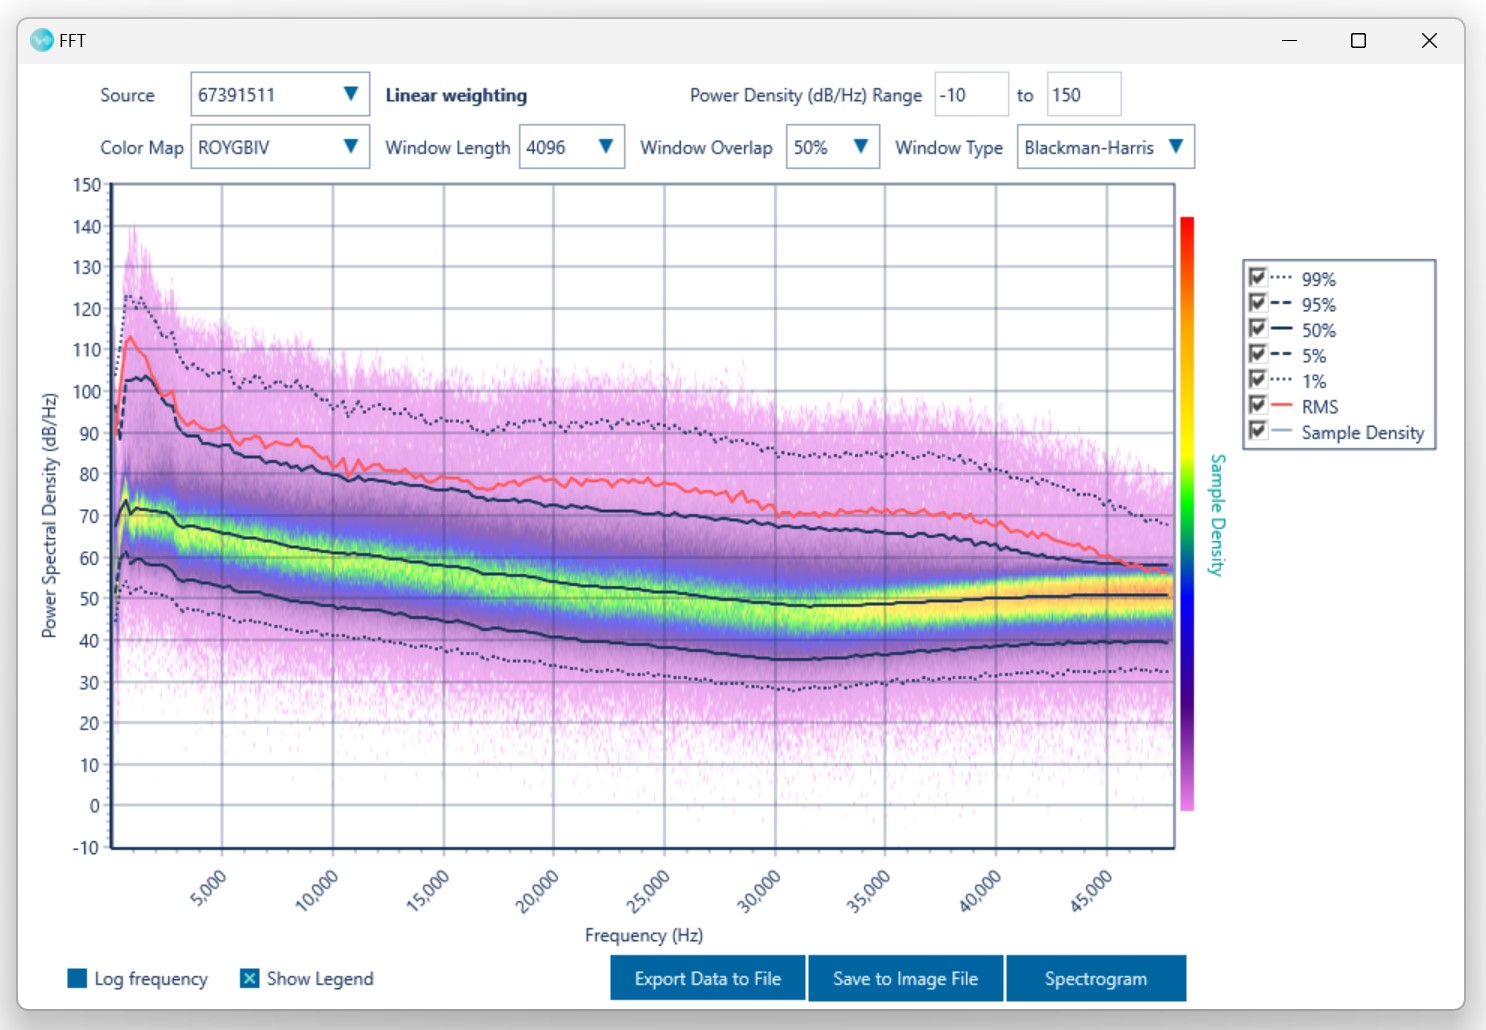
Power spectral density curves are shown along with a visual representation of the sample distribution.
The spectral plot is initially displayed with frequency in a linear scale. This can be changed to logarithmic scale by clicking the ‘Log frequency’ checkbox. Increasing the overlap and window length increases resolution, but also the processing time required.
Various window types can be selected from the dropdown menus. The default Blackman-Harris is a good general-purpose window and suitable for most applications. Other window types may be suitable depending on the frequency content of the signal.
The power spectral density curves can be viewed for each source by selecting from the dropdown menu.
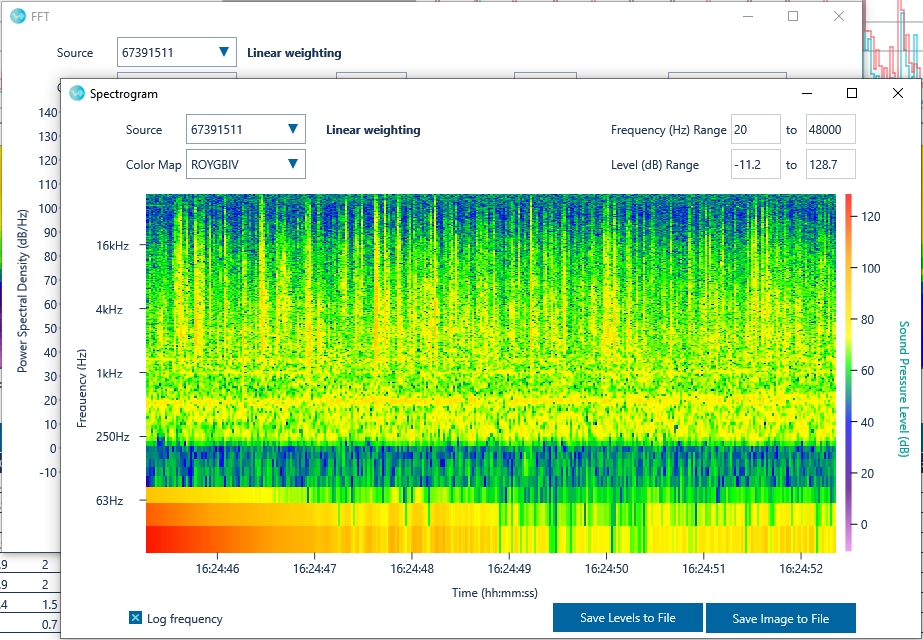
The spectrogram button enables visualisation of the FFT varying with time.
Signal#
The Signal view will enable the user to view the high resolution signal of the full-resolution measurement files. As with the FFT the selection time would ideally be kept to a minimum to avoid excessive processing delays.
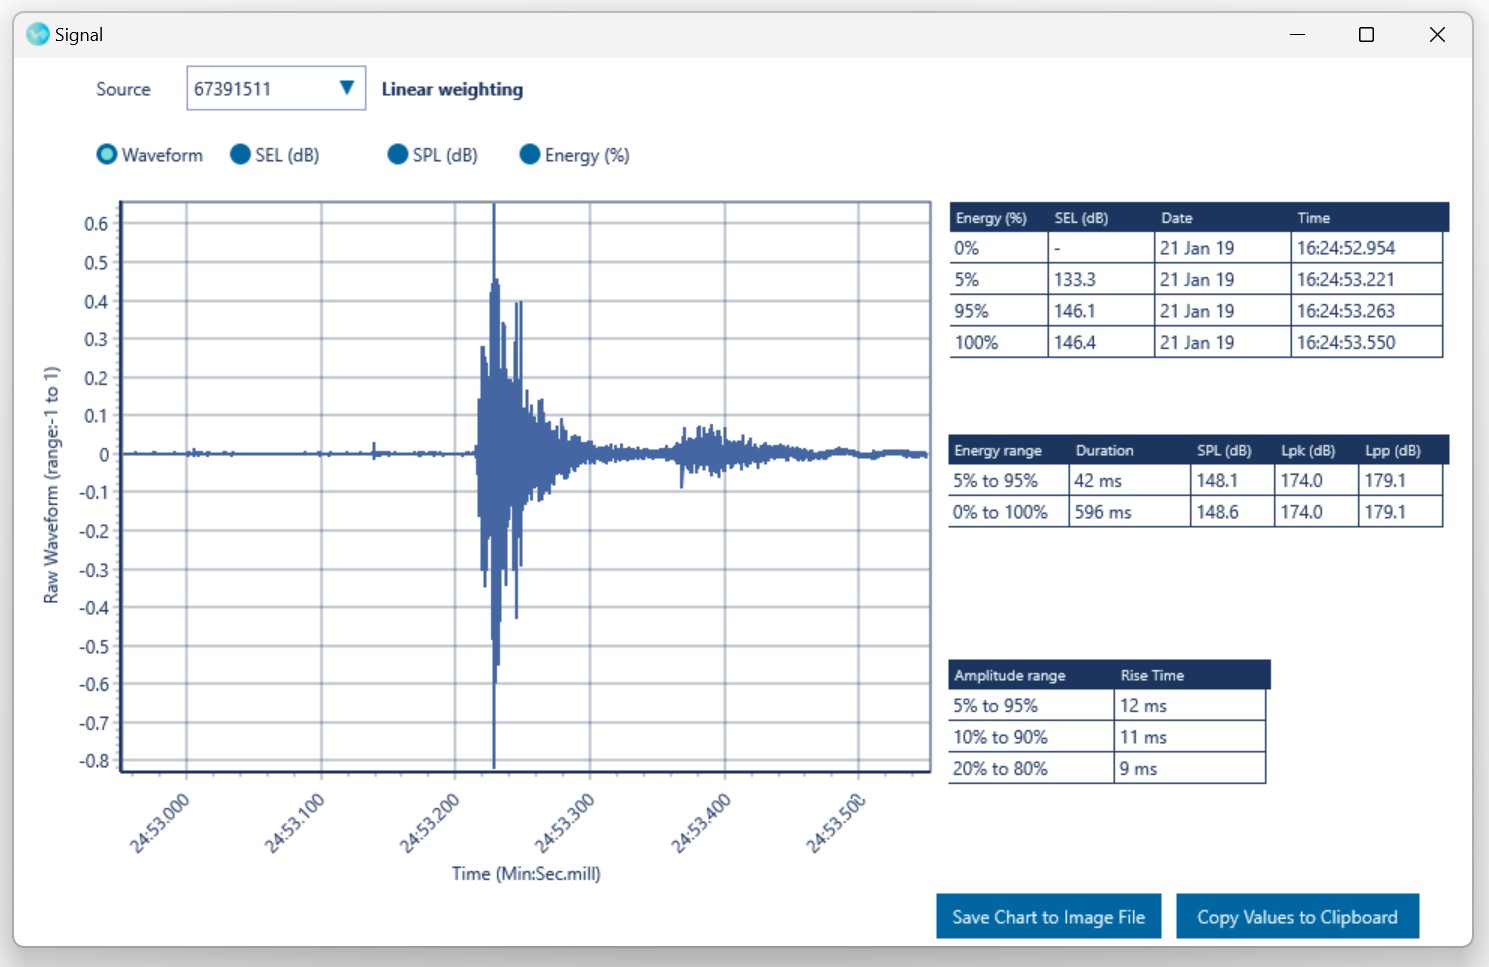
The four radio buttons above the signal plot enable the user to select the type of display.
- Waveform: Shows the raw signal of the measurement file. The signal is limited to ±1, which is the maximum range of the signal.Useful for identifying overloads and signal clipping.
- SEL: The accumulated sound exposure level in dB.
- SPL: Instantaneous sound pressure level in dB.
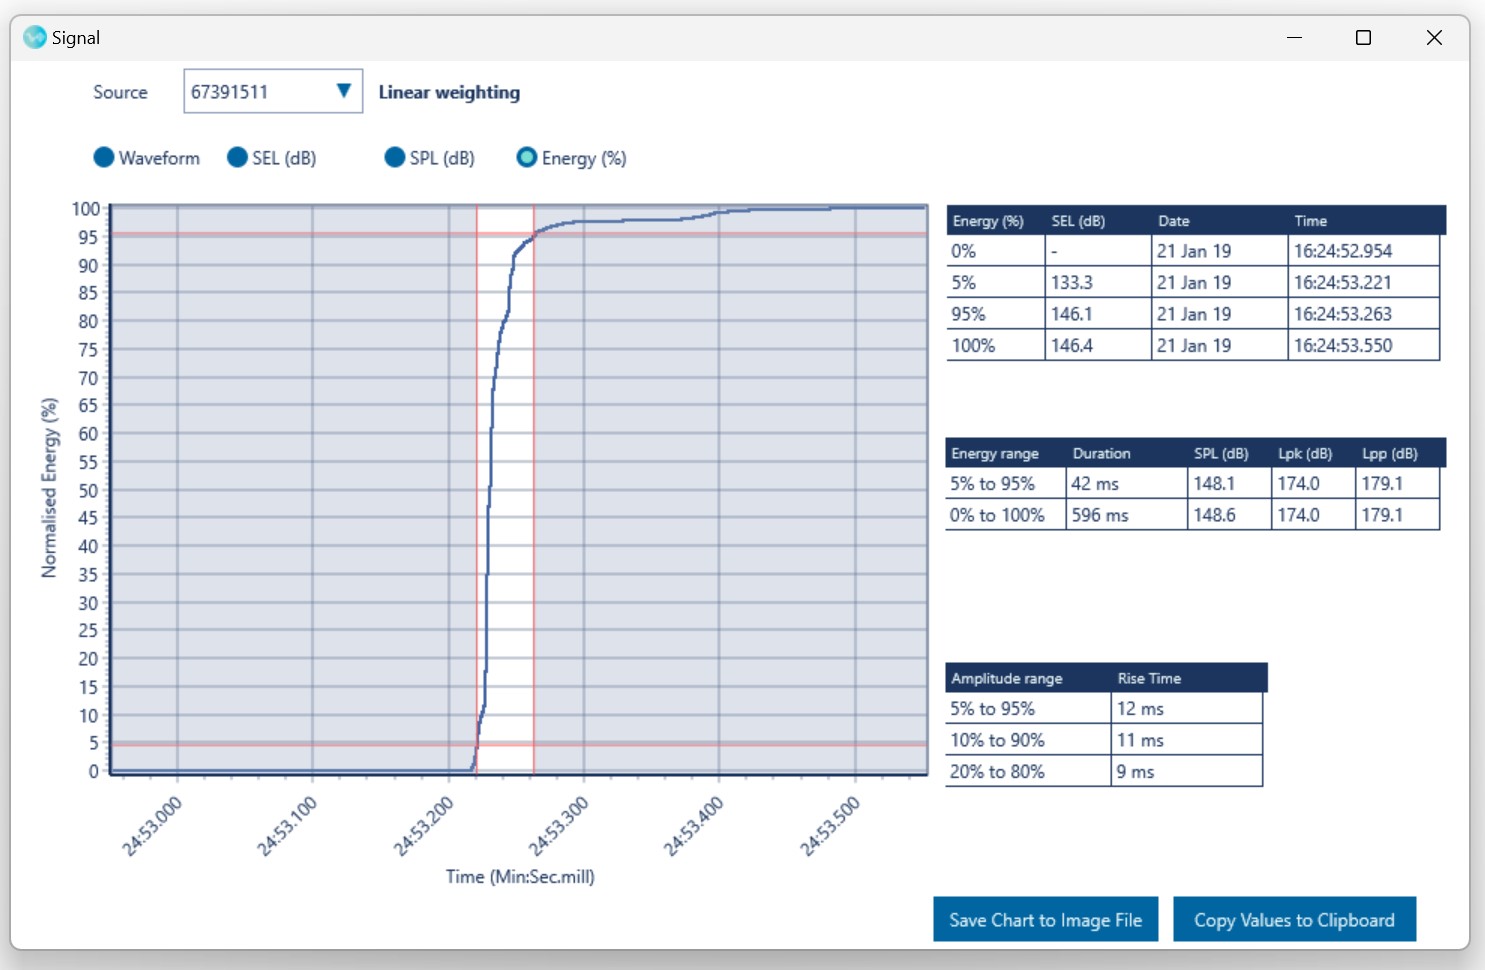
- Energy: The accumulated energy (exposure) as a percentage of the total selected signal. Useful for finding pulse durations and rise times of individual pulses.
The tables on the right display the calculated rise times and durations of the selected signal.
Bands#
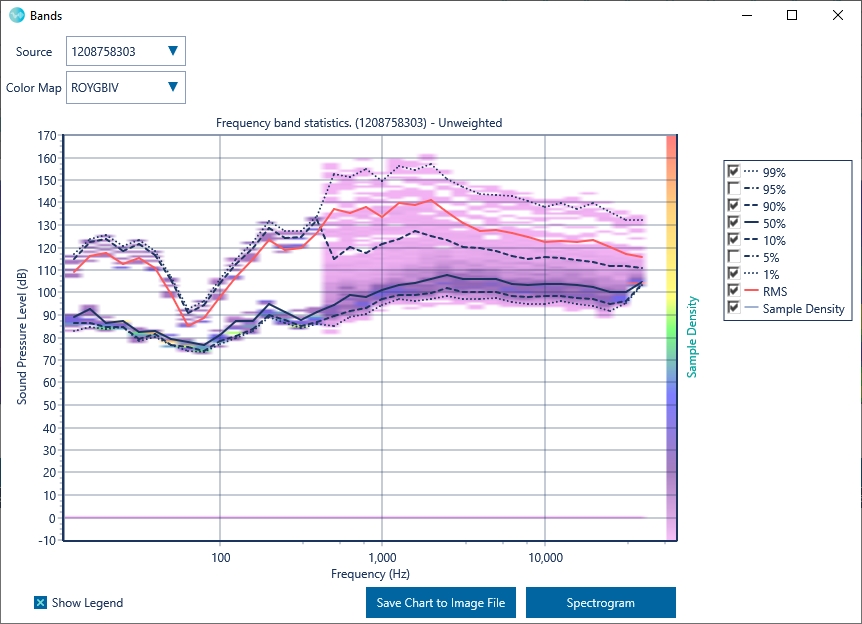
The Band vs Time view enables visualisation of the 1/3 octave bands, weighted to reflect the setting selected on the home screen, as well as a visual representation of the sample distribution.
This performs a similar function to the FFT, but it is significantly faster. This is because the spectrogram displays the data already stored in the LVX files. This enables the Bands function to summarise date from a selected period data in real time.
Probability density curves can be viewed by click on the ‘View frequency statistics’ checkbox.
Exposure#
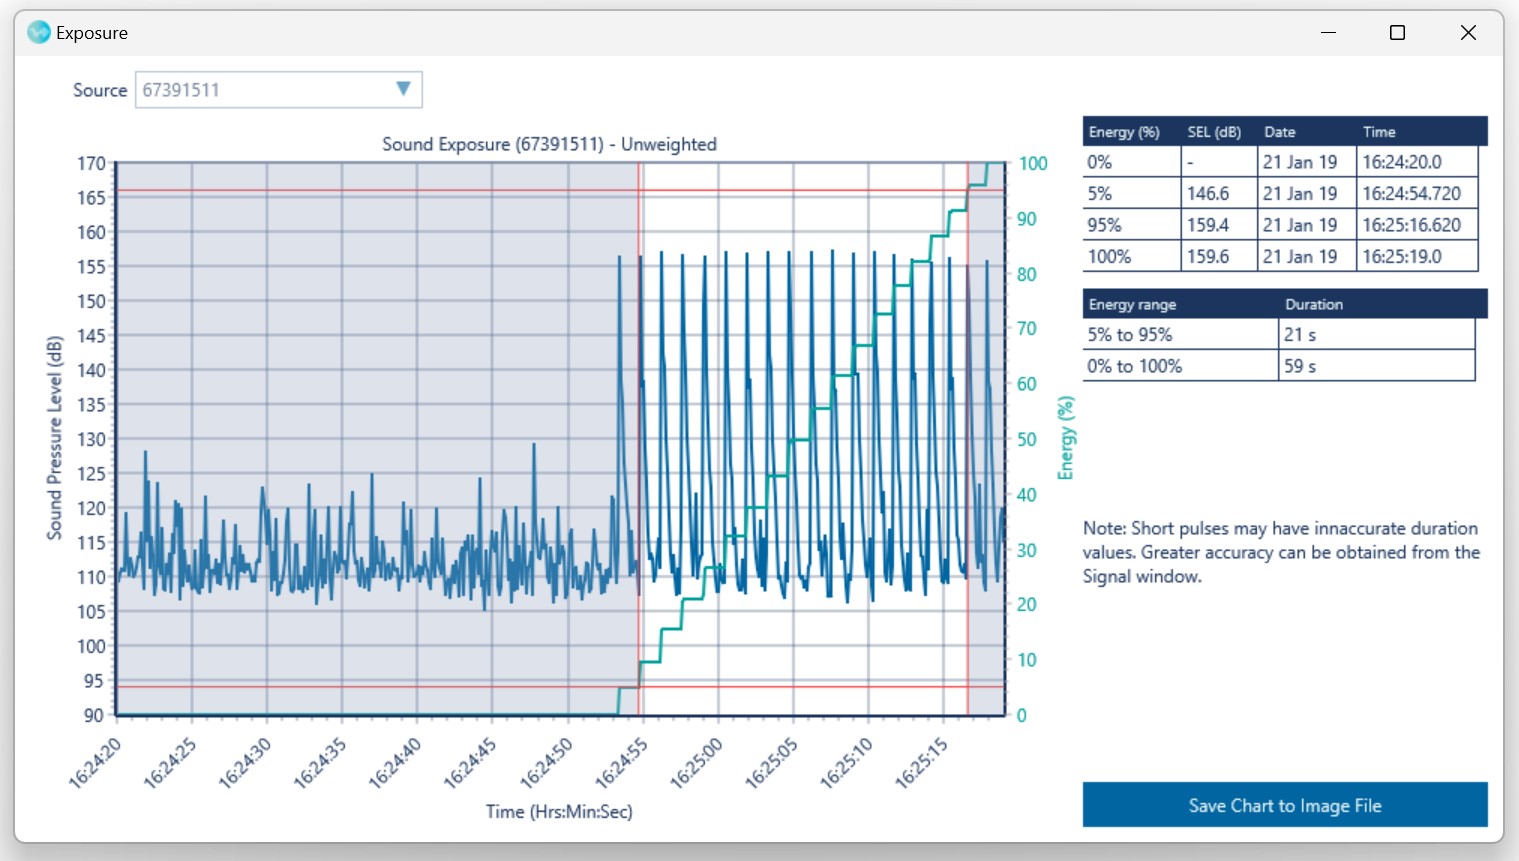
The Exposure module enables evaluation of cumulative exposure over the selected period. It also presents time stamps for the 90% energy interval (that is, between 5% and 95%) and marine weightings can be applied to enable direct comparison with relevant cumulative exposure criteria. It is particularly useful for evaluating cumulative exposure from activities such as multiple strikes during pile driving.
Note
The Exposure view uses the LVX files for calculations. For individual pulses this method may produce inaccurate duration values. In such cases it is better to use the Signal view which accesses the measurement file.