Navigating the time trace and spectrogram plots#
Panning#
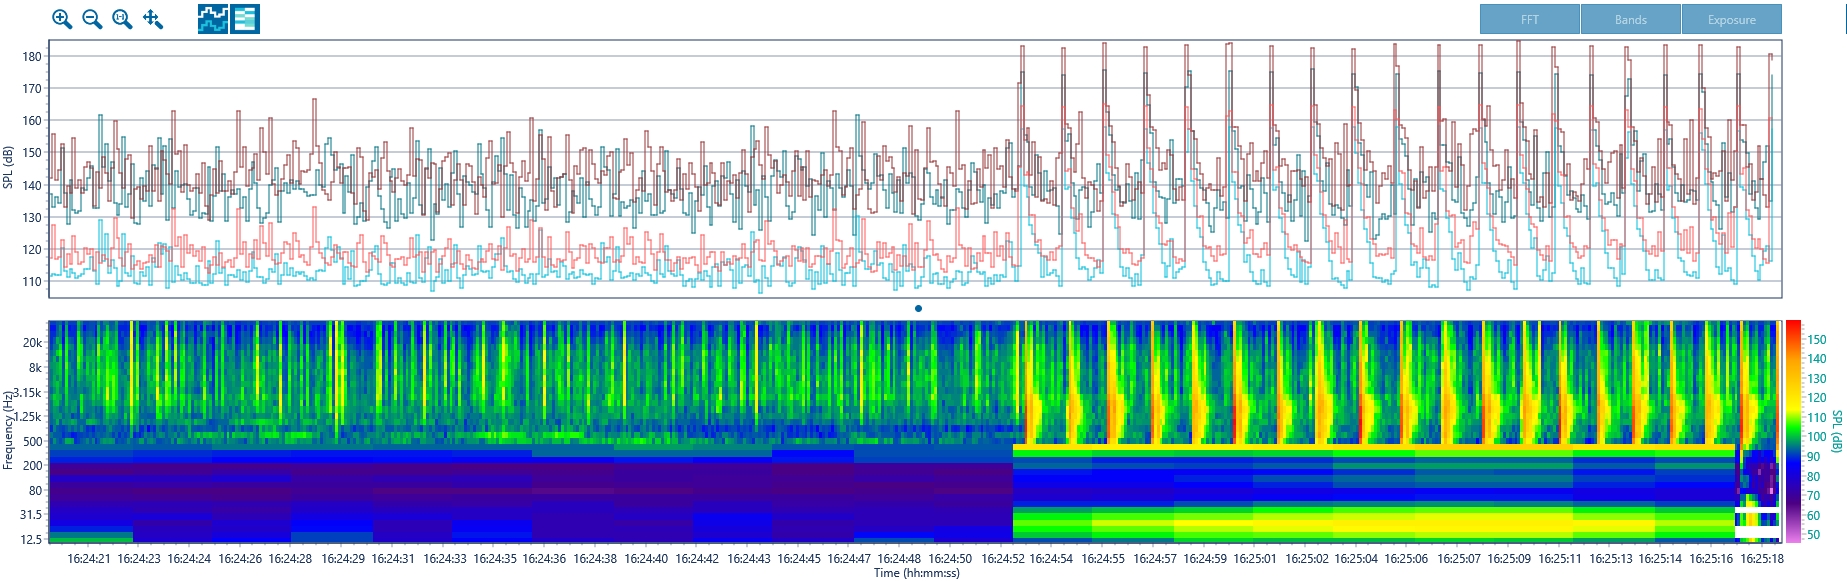
To navigate by panning in the time-trace or spectrogram plot, right click the mouse, hold and drag left and right. The same effect can be achieved by holding the SHIFT button down and using the mouse scroll wheel. This can be more useful when systematically searching for an event.
Zoom#
To zoom in and out, use the scroll wheel on the mouse or the +/- buttons  at the top left-hand side of the plot. The zoom function is centred on the location of the mouse.
You can also select a section of the time trace or spectrogram plot and then zoom to the extents of this selection using the  button.
Reset view#
Reset the view of the plot to show all of the by clicking the reset button 
Multiple hydrophones#
With multiple hydrophones loaded, the screen can look quite cluttered. Individual time-traces can be selected on the plot to simplify the view.
Hiding time traces#
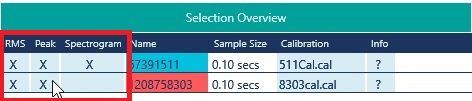
In the Overview tab, you will see RMS and Peak for each hydrophone. Clicking RMS will show and hide the RMS trace for the hydrophone.
Similarly, toggling Peak will show and hide the Peak trace
Selecting the spectrogram#
You can only view only spectrogram at a time. You can select the spectrograms to view by toggling the cell under Spectrogram in the Overview tab.
Displaying time trace and spectrogram plots#
The level and spectrogram plots can be toggled on/off using the  buttons